Population and housing growth in Surrey
Unfortunately, the Office for National Statistics (ONS) local authority-based population projections are significantly out of date, with the last update based upon 2018 population data (published in March 2020).[1] The ONS January 2024 projections show the population of England and Wales will rise by 6.6 million (9.9%) from 2021 to 2036, reaching 73.7 million.[2] This is a significant increase compared to the 2018 estimate, which projected this figure to only be reached in 2046, largely due to underestimated migration effects. Consequently, we expect that when local authority projections are updated later this year, we expect a similar increase in local population growth, in line with national trends.
The latest ONS growth figures show that Surrey’s population is currently growing, with a 2022-23 rate of population growth standing at a 1% increase.[3] It is considered likely that this rate will continue due to the recently updated ONS population projections for England and Wales which has projected a very significant increase in population predominantly driven by inward migration.[4] Furthermore, there have been recent changes made to the planning standard methodology for housing which has provided very significant housing targets for Surrey. This is also paired with the government’s new grey belt policy which will release significant land in Surrey which was historically unavailable for development. The assumptions made by the government in the Standard Methodology for housing state:
11. We propose 0.8% of existing housing stock in each local planning authority as the baseline starting point. The most robust data source of stock levels is the annually published Dwelling stock estimates by local authority districts and the most recent data published at the time should be used. On average, housing stock has grown nationally by 0.89% per year over the last 10 years. Using a figure of 0.8% therefore provides a level of increase in all areas that is consistent with average housing growth over time, a baseline which banks the average status quo level of delivery, to then be built on through affordability-focused uplifts.[5]
Under the Standard Methodology the housing targets for Surrey are 38% higher than the national average, and therefore it would appear that government is expecting that that the housing stock in Surrey will increase by 1.104% per annum. Taking this into account, as well as Surrey’s recent population growth, an assumption that at least 1% population growth will occur year on year is considered highly reasonable.
Surrey is an economically prosperous and attractive place to live. It is possible that growth could be higher than 1%, given that this population growth rate is already being achieved with modest Local Plan coverage and the new methodology is likely to drive greater quantities of development and ensure full and up to date Local Plan Coverage. The impact of grey belt changes will also drive additional housing in Surrey.
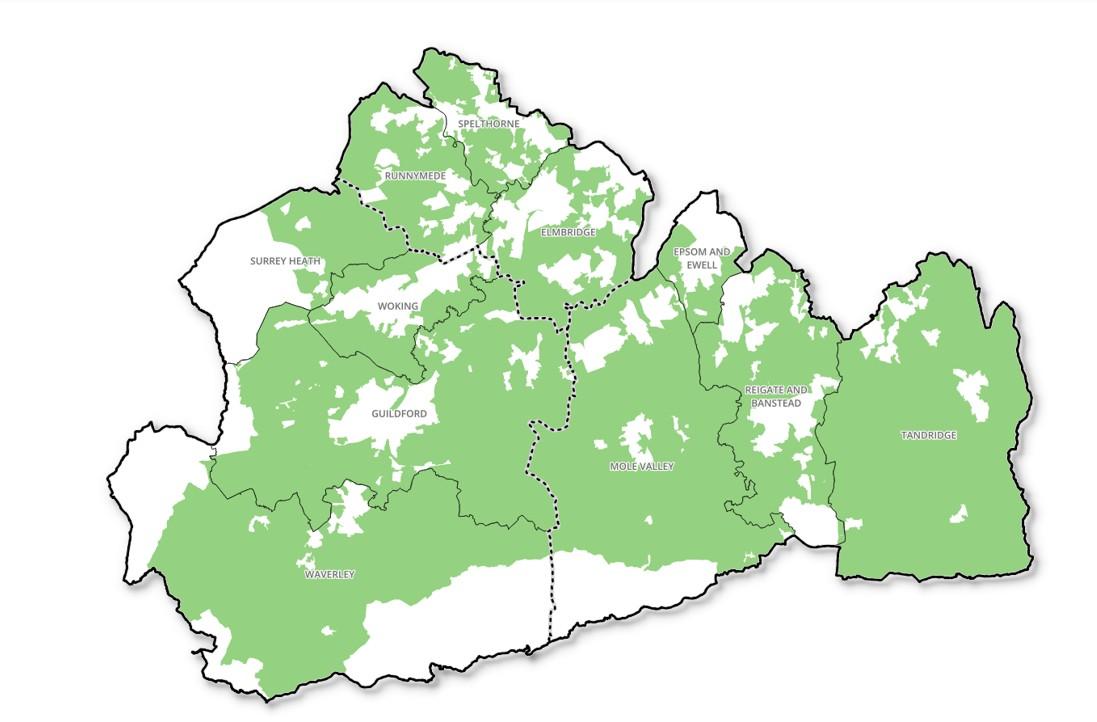
A map showing the extent of the existing Green Belt designation across Surrey is shown below. A comprehensive map showing how much of this land is grey belt does not currently exist, although this is being established in response to this term becoming embedded into national planning policy in December 2024. This is on a case-by-case basis in response to planning applications, and in some areas, at a strategic level using government funding.
However, for the purposes of this paper it is assumed that the population of Surrey will increase by 1% per annum in line with current trends, national projections and Surrey’s ambitious nationally set housing targets.
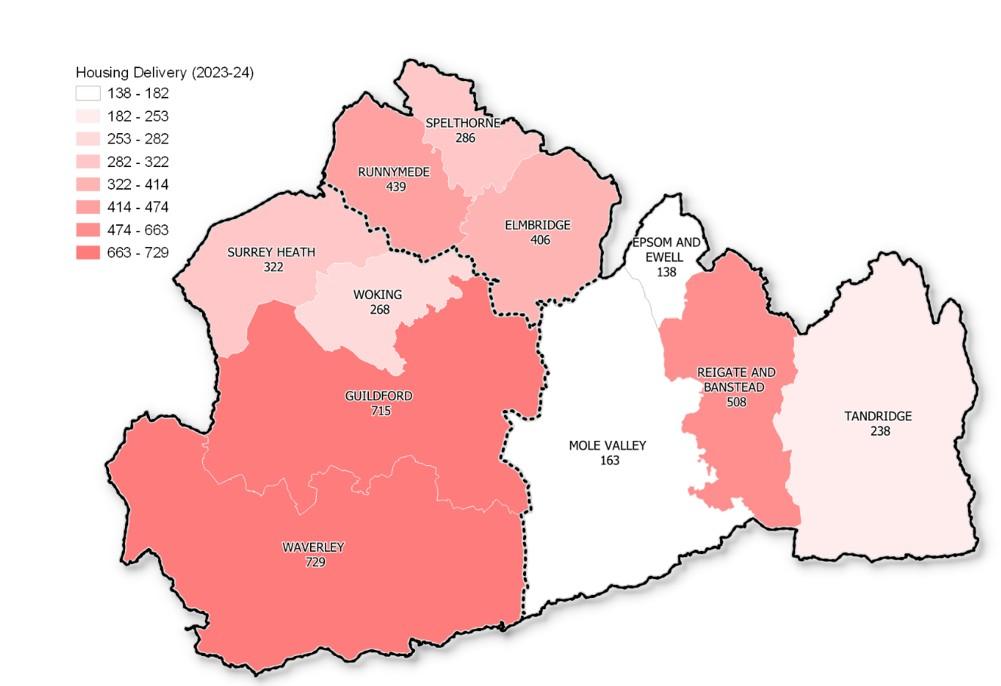
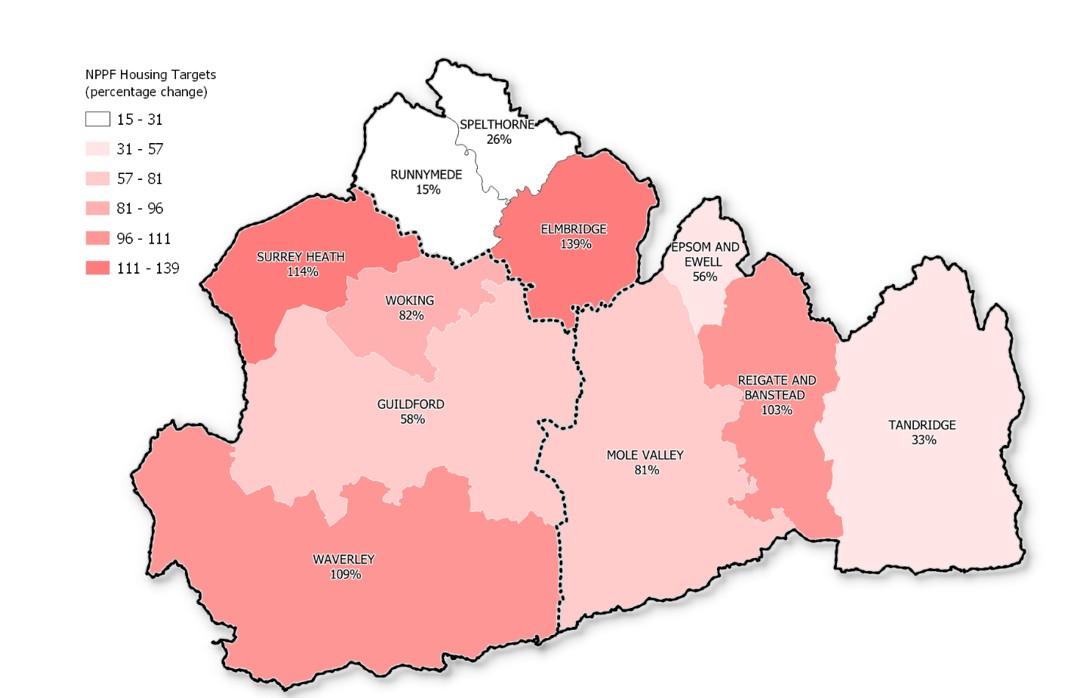
The maps below show the current delivery rates across Surrey for the 2023/24 year, as well as the increased delivery targets as a result of recent changes to the National Planning Policy Framework.
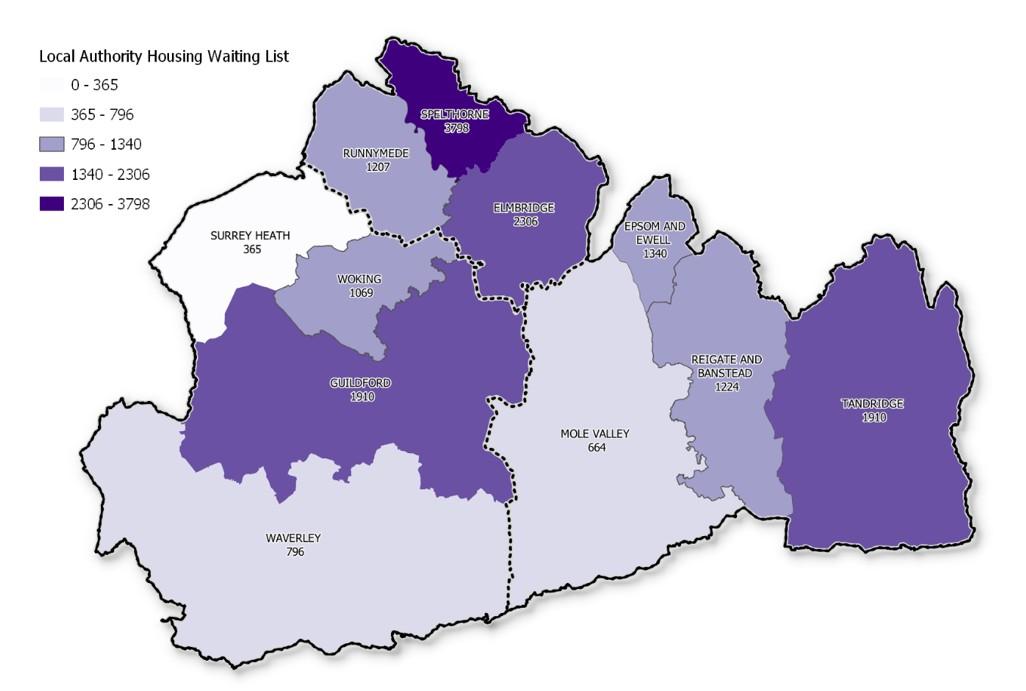
Significantly boosting the supply of housing across the county above the historic rates will be vital to address the affordability pressures which exist across the county. These pressures are at least in part evidenced by the number of households on the local authority housing waiting lists across Surrey as shown on the map below. At a more local level, affordability pressures are discussed in more detail in the pen portraits later on in this submission for each of the proposed 3 unitary authority areas.
When considering areas with three or more dimensions of deprivation:
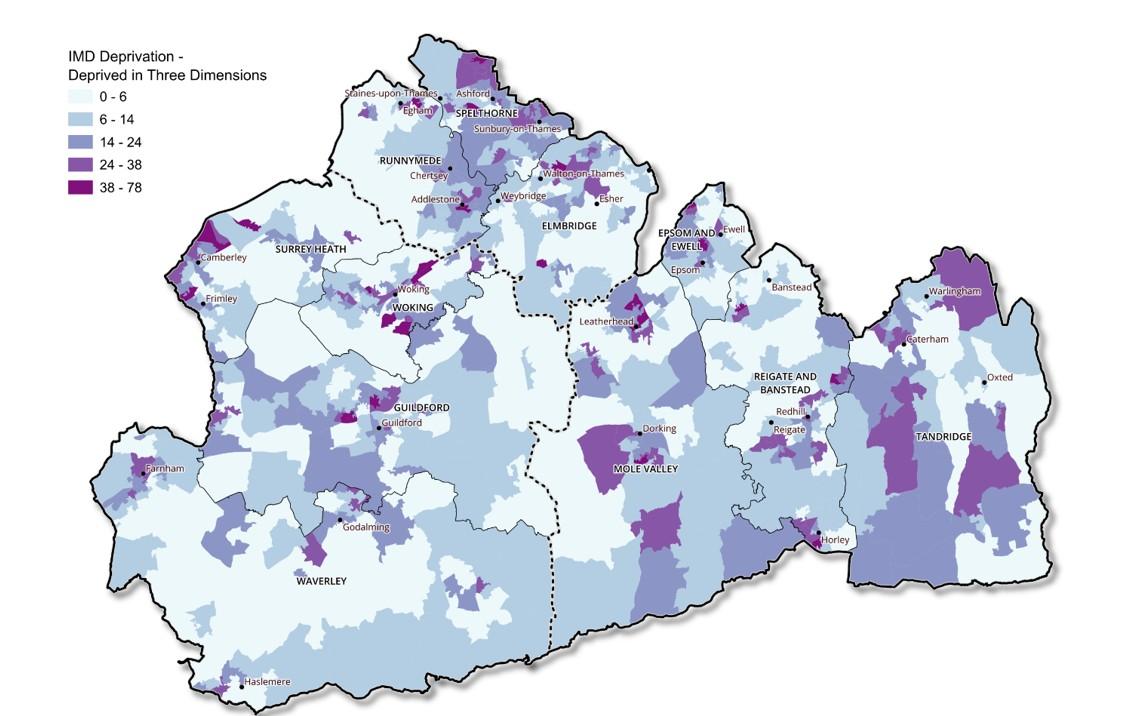
It is apparent that there are pockets of deprivation across the county. Local housing market pressures reflect the challenges that pockets of deprivation bring.
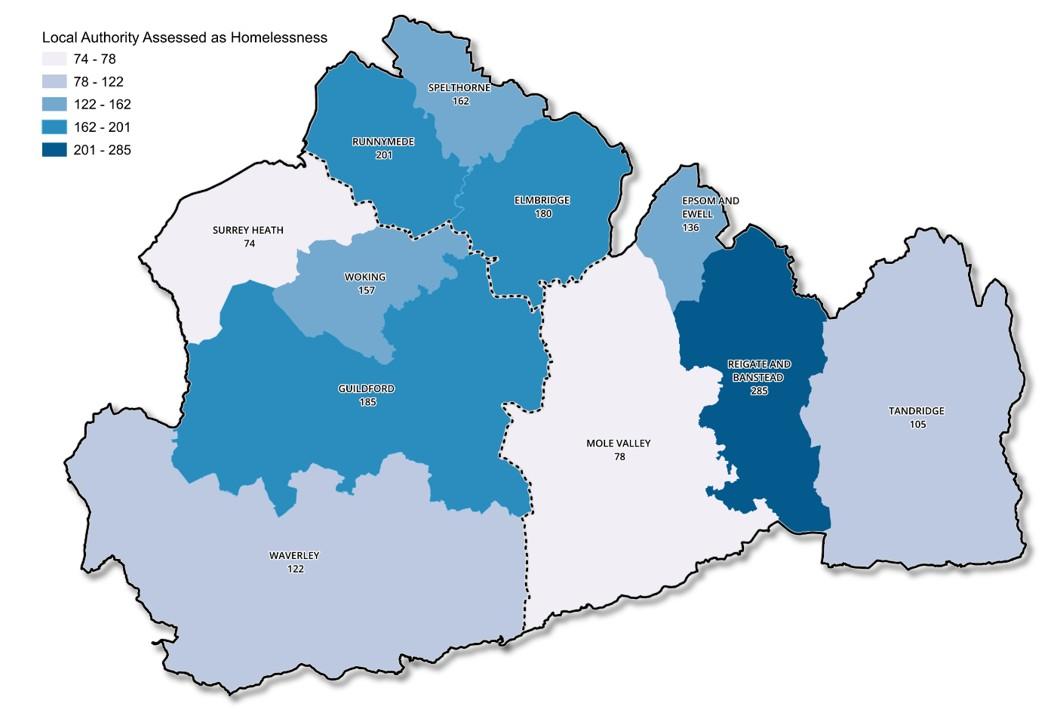
The map overleaf demonstrates that homelessness acceptances correlate with high-cost, urban areas. This is something that is common across Surrey councils now, with links to deprivation in those areas:
Bringing together the three proposed unitary councils will facilitate local service delivery to meet bespoke challenges, building resilience in front line services and an agility in the way services are delivered to meet the needs of communities. This would be unachievable in larger, more distant unitary council environments.
[1] ‘Population projections for local authorities’, Office for National Statistics, 24 March 2020.
[2] ‘National population projections: 2021-based interim’, Office for National Statistics, 30 January 2024.
[3] ‘Population Estimates’, Office for National Statistics, Surrey-I, 2023.
[4] ‘National population projections: 2022-based’, Office for National Statistics, 28 January 2025.
[5] ‘Proposed reforms to the National Planning Policy Framework and other changes to the planning system’, Ministry of Housing Communities and Local Government, 27 February 2025, Chapter 4, Paragraph 11.
This form helps us improve the content and structure of our webpages only, and we cannot provide a response to any submission below.